Great Data on Migration


I just found an interesting new website full of migration data (link here). The website contains migration data for almost every county in the US.
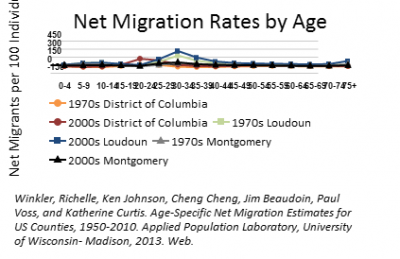
One thing I have learned: the migration into cities is still largely driven by twentysomethings. For example, Manhattan and Washington continued to lose older residents to suburbia and to other regions, as they did in prior decades.
How, then, have these places gained population in recent decades? First, twentysomethings are moving to these cities in larger numbers. In th 1970s, Washington, D.C.'s net gain of 20-24 year olds was 6.7 per every 100 people- that is, the number by which in-migrants exceeded outmigrants was 6.7 per 100 twentysomethings. By contrast, in the 2000s the city's net gain was over 100 people per 100 (which i guess mean that twice as many 20-24 year olds moved in as left). In addition, people stayed in the city longer: in the 2000s, net migration for 30-34 year olds was positive, though it became negative after age 35.
Second, older people did not leave the city as rapidly as in prior decades. In the 1970s, Washington's negative migration rate among 55-59 year olds was 16.3 per 100 people, as opposed to 6.5 in the 2000s. Similarly, the city's negative migration rate among40-44 year olds was 31.7 percent in the 1970s and 21.7 percent in the 2000s. So even among people predisposed to move towards suburbia, the city bled fewer people in the 2000s.


Comments
Write your comments in the box below and share on your Facebook!